If you were at the 2023 Utah Geographic Information Council (UGIC) Conference in May, you might remember that I presented on Generating Useful Data with Computer Vision Tools, opens in a new tab. But my second use case, detecting cooling towers in aerial imagery for the Utah Department of Health and Human Services (DHHS), was still a work in progress with results yet to be determined. I promised to provide an update via blog post, and now I’m (finally) fulfilling that promise.
SIDE NOTE: Shortly after UGIC, I accepted a new position as the GIS Manager in the Salt Lake County Surveyor’s Office. Although I’m no longer at UGRC, we were able to complete the data processing and validation before my transition to Salt Lake County.
Background
Knowing the location of cooling towers in the state is important to DHHS, because it can significantly streamline investigations into Legionella outbreaks. Legionella is a bacteria that can cause a serious type of pneumonia called Legionnaires’ disease. The bacteria can grow/spread in large building water systems, including water tanks, HVAC components, large/complex plumbing systems, and cooling towers. Cooling towers are particularly concerning because they can release aerosolized water into the atmosphere. If Legionella is present, the aerosolized water can spread the bacteria over miles1.
Cooling towers can cause outbreaks of Legionnaires’ disease when they are not adequately maintained. They are often investigated and located using aerial imagery during Legionnaires’ outbreaks and have distinctive features that make them identifiable2. The combination of distinctive features and the high resolution of aerial imagery makes detecting cooling towers a good candidate for computer vision tools. In fact, researchers and the CDC have already begun to use object-detection models like TowerScout, opens in a new tab to identify potential cooling towers in aerial imagery. TowerScout is based on the YOLOv5 model, opens in a new tab within the PyTorch, opens in a new tab framework. For this project, the TowerScout developers provided us a pre-trained version of the model, which we used to scan aerial imagery in Utah. The Python code was executed using Cloud Run Jobs, opens in a new tab in the Google Cloud Platform.
Methodology
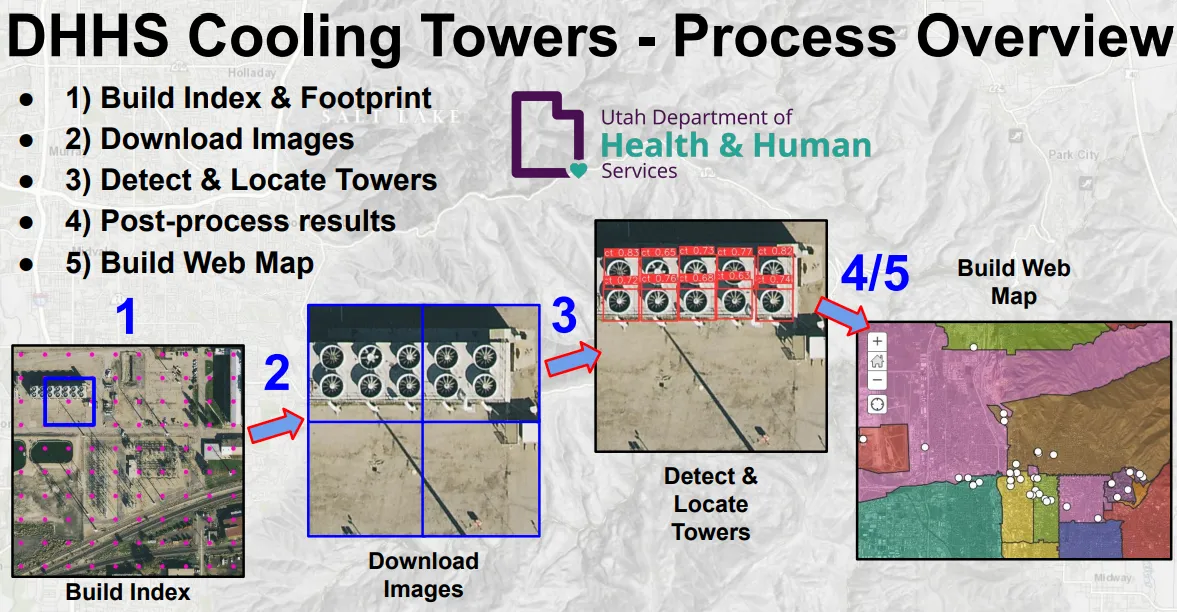
The rest of this blog post will largely focus on the project results, because the methodology of the project was covered in detail in the UGIC presentation, opens in a new tab (slides 33-43). A brief summary is listed below:
- Build an imagery index & processing footprint
- Build the tile index at the highest zoom level (20)
- Generate the processing footprint by buffering census places and large buildings (>5k sq ft) by 800 meters
- Select the tile indices within the processing footprint
- Get the imagery
- Download the images that fall within the footprint from UGRC Discover service
- Combine the adjacent images into a 2x2 mosaic (512x512 pixels provided the best results)
- Detect & locate the towers in each mosaic image
- Run the TowerScout PyTorch model on each mosaic
- Calculate the X/Y coordinates of any detected tower centroid
- Save the results in a CloudSQL database table
- Export a CSV from the database and build the spatial data from the coordinates (feature class)
- Post-process results
- Manually review detections with confidence > 0.5 to ensure validity
- Enrich the data with additional attributes
- Build a web map with other relevant layers

Results
Much like the parcel detection project for the Utah Department of Transportation (UDOT), the cooling towers project was greatly enabled by cloud computing and the scaling it provides. By processing the imagery in the cloud, we were able to complete 225 days (5,400 hours) worth of wall-clock computing time in 9 days. And we could have done it faster, but we were processing image tiles from our production imagery server, so we intentionally spread out the workload to avoid impacting other users.
In the PyTorch model, we took the approach of maximizing cooling tower detections by lowering the model’s confidence threshold. That way, we could prioritize data validation on the high-confidence detections, but keep the low-confidence detections available, in case some of them were good or we wanted to review additional detections at a later time. (In testing, some detections with confidence scores as low as 0.01 ended up being valid).
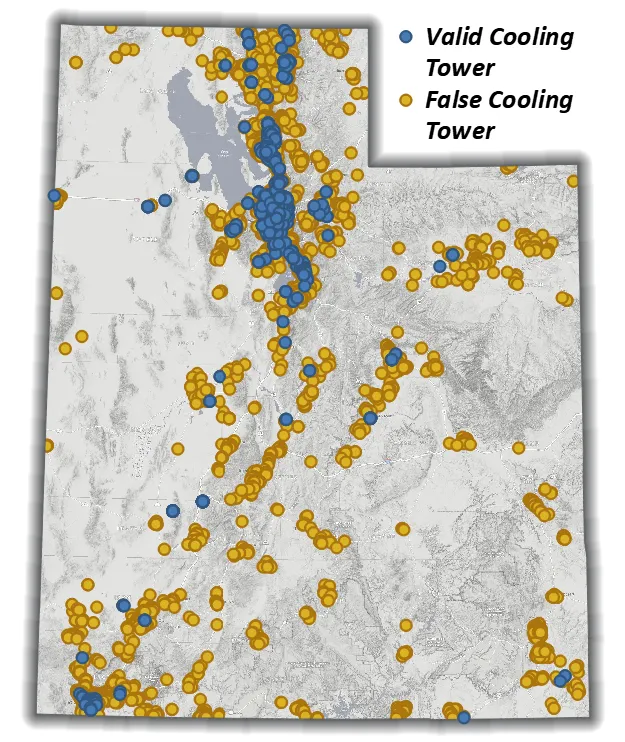
In the end, the TowerScout model detected 6,324 potential towers with a confidence score > 0.5. These relatively high-confidence detections were manually reviewed, and 1,561 tower locations were validated.

Next Steps
The final steps in the project will include enriching the geospatial data with additional attributes and building a web map for DHHS to use in Legionella outbreak investigations. The additional attributes will include things like the nearest address, county, municipality (if applicable), zip code, small health statistical area, health department, etc., for a given cooling tower.
Footnotes
-
Controlling Legionella in Cooling Towers, accessed July 03, 2023. https://www.cdc.gov/legionella/wmp/control-toolkit/cooling-towers.html, opens in a new tab. ↩
-
CDC Procedures for Identifying Cooling Towers, access July 03, 2023. https://www.cdc.gov/legionella/health-depts/environmental-inv-resources/id-cooling-towers.html, opens in a new tab ↩